Data Logger View
In the Data Logger view, the computer's clock controls measurement start/stop/interval, and readings are stored in a data log on the computer.
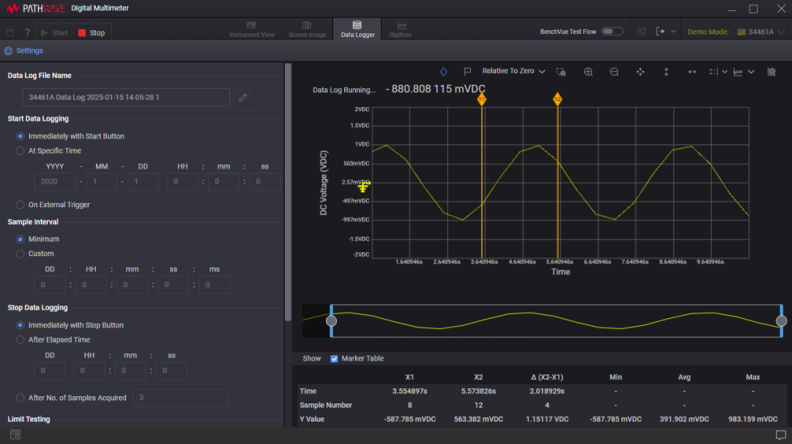
Data Log Name
The default file name consists of the DMM model number followed by "Data Log", the date, current time, and a numeric index. For example, 34411A Data Log 2021-09-20 11-40-26 31.
For example – C:\Users\<user_name>\Documents\Keysight\PathWaveDMM\Data Logs\.
To change the default name, click  to open the file name editor. You can edit the prefix name and also have the option to include or exclude the date, current time, and numeric index. The date is in the form YYYY-MM-DD and the time is in the form HH-mm-ss (24-hour time format). For example, <model> Data Log 2021-09-20 11-40-26 31 – September 20, 2021 at 11:40:26 a.m. with a numeric index of 31.
- If included, the date, time, and numeric index fields are automatically updated with each subsequent data log operation from this application.
- The date and time fields are based on your computer's internal clock setting.
- The data log is stored with a .IVIF file extension.
Start Data Logging
Immediately with Start Button - Start data logging when you click the "Start" button.
At Specific Time - Start data logging at a specific time and date. Enter the desired date in the form YYYY (year), MM (month), and DD (day). Enter the desired time in the form HH (hours), mm (minutes), and ss (seconds).
On External Trigger (one per reading) - Trigger on a negative-going (falling) edge of an external signal on the DMM's Ext Trig connector (external triggering is not supported on the Keysight 34401A DMM).
Sample Interval
Enter the desired interval between samples in the form DD (days), HH (hours), mm (minutes), ss (seconds), and ms (milliseconds). Select Minimum to select the shortest interval based on the instrument's current settings.
Stop Data Logging
Immediately with Stop Button - Terminate data logging when you click the "Stop" button.
After Elapsed Time - Terminate data logging after the specified amount of time has elapsed. Enter the desired duration in the form DD (days), HH (hours), mm (minutes), and ss (seconds).
After Number of Samples Acquired - Terminate data logging after a specific number of samples have been taken (the minimum number of samples is 2).
Limit Testing
Check readings against upper and lower limits. A limit failure occurs when the measured signal goes above the upper limit, or below the lower limit.
Enable Limit Testing - Select this check box to enable limit testing. When limit testing is enabled:
- the upper and lower limits markers are shown on the chart with a horizontal orange line (click here to see an example).
- warning message is displayed on the Notifications for each limit failure.
Upper Limit - Specify the upper limit in the units of the selected measurement (must be greater than the lower limit).
Lower Limit - Specify the lower limit in the units of the selected measurement (must be less than the upper limit).
Actions to Take When Limit Reached
Send Computer Beep - The PC beeps on each limit failure.
Send E-mail Message - Sends an e-mail to the specified recipient upon the first limit failure (multiple failures per test result in just one e-mail). Click
to specify an e-mail recipient.
Execute Batch File - Execute a custom batch file upon first limit failure (multiple failures per test result in executing the batch file just once). After enabling this mode, click Browse to locate and select the batch file that you have created.